Zipkin是一种分布式跟踪系统,它有助于收集解决微服务架构中得延迟问题所需的时序数据,它管理这些数据的收集和查找。
1. 架构概述
跟踪器存在于您的应用程序中,并记录有关发生的操作的时间和元数据。他们经常使用库,因此它们的使用对用户是透明的。例如,已检测的Web服务器会在收到请求时以及何时发送响应时进行记录。收集的跟踪数据称为Span。
编写仪器是为了安全生产并且开销很小。出于这个原因,它们只在带内传播ID,以告诉接收器正在进行跟踪。Zipkin带外报告已完成的跨度,类似于应用程序异步报告度量标准的方式。
例如,在跟踪操作并且需要发出传出的http请求时,会添加一些标头来传播ID。标头不用于发送操作名称等详细信息。
将数据发送到Zipkin的检测应用程序中的组件称为Reporter。记者通过几种传输之一将跟踪数据发送到Zipkin收集器,这些收集器将跟踪数据保存到存储中。稍后,API会查询存储以向UI提供数据。
描述此流程,如下图表:
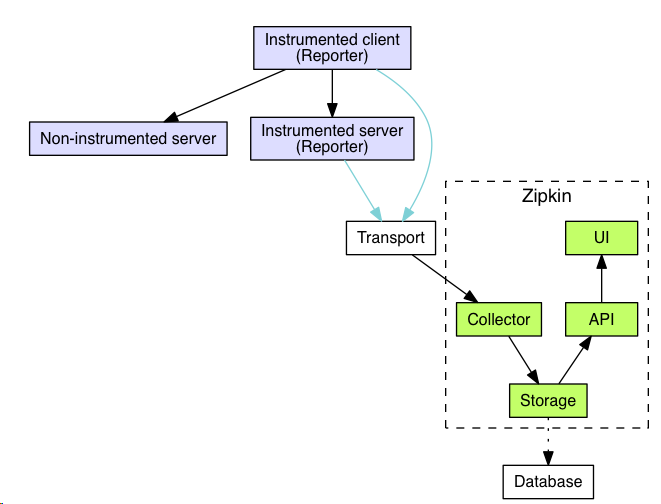
Zipkin作为一个收藏家,一旦跟踪数据到达Zipkin收集器守护程序,它就会被Zipkin收集器验证,存储和索引查找。
Zipkin查询服务,一旦数据被存储和索引,我们需要一种方法来提取它。查询守护程序提供了一个简单的JSON API,用户查找和检索跟踪。
参考官网:https://zipkin.io/
2. 快速开始
本文,我们将介绍构建和启动Zipkin实例,以便在本地检查Zipkin。根据官网显示,有三种选择:使用Java、Docker或从源代码运行。
如果您熟悉Docker,这是首选的方法。如果您不熟悉Docker,请尝试通过Java或源代码运行。
Zipkin分为两端,一个是Zipkin服务端,一个是Zipkin客户端(微服务应用)。客户端会配置服务端的URL地址,一旦服务间调用的时候,会被配置在微服务里面的Sleuth的监听器监听,并生成相应的Trace和Span信息发送给服务端。
发送的方式主要有两种,一种是Http报文的方式,还有一种是消息总线的方式如:RabbitMQ
我们这边采用的是Http报文的方式。
Zipkin服务端构建
1. 引入依赖
解析:主要引入两个Jar:zipkin-server、zipkin-autoconfigure-ui,其中对应的版本为:2.12.2。
zipkin-server 本身包含了 log4j,如果系统已经引入log4j包,为了避免冲突,需要在此处将本jar包去除。
<dependencies>
        <!-- zipkin server -->
        <dependency>
            <groupId>io.zipkin.java</groupId>
            <artifactId>zipkin-server</artifactId>
            <exclusions>
                <exclusion>
                    <groupId>org.springframework.boot</groupId>
                    <artifactId>spring-boot-starter-log4j2</artifactId>
                </exclusion>
            </exclusions>
            <version>${zipkin}</version>
        </dependency>
        <!-- zipkin ui -->
        <dependency>
            <groupId>io.zipkin.java</groupId>
            <artifactId>zipkin-autoconfigure-ui</artifactId>
            <version>${zipkin}</version>
        </dependency>
    </dependencies>
2. 配置文件
spring:
  application:
    name: zipkin-server
  security:
    user:
      name: zhangsan
      password: 111111
---
# 服务端口
server:
  port: 9411
---
eureka:
  instance:
    # 解决健康节点权限问题 将用户名及密码放入eureka的元数据中
    metadata-map:
      user.name: ${spring.security.user.name}
      user.password: ${spring.security.user.password}
  client:
    service-url:
      defaultZone: http://${spring.security.user.name}:${spring.security.user.password}@peer1:8761/eureka/,http://${spring.security.user.name}:${spring.security.user.password}@peer2:8762/eureka/
---
# 客户端负载均衡器
ribbon:
  ConnectTimeout: 3000 # 客户端连接超时
  ReadTimeout: 60000 # 客户端读取超时
  MaxAutoRetries: 1 # 当前环境最大重试次数
  MaxAutoRetriesNextServer: 2 # 其他环境最大重试次数
  eureka:
      enabled: true
---
hystrix:
  command:
    default:
      execution:
        timeout:
          enabled: false
---
# 关闭自动配置启用所有请求得检测
management:
  metrics:
    web:
      server:
        auto-time-requests: true
注:如果配置文件中没有添加“management.metrics.web.server.auto-time-requests=false”,默认为 开启自动检测请求
在启动zipkin-server过程中,会报以下问题:
java.lang.IllegalArgumentException: Prometheus requires that all meters with the same name have the same set of tag keys. There is already an existing meter containing tag keys [method, status, uri]. The meter you are attempting to register has keys [exception, method, status, uri].
解决方案:
-
a、配置文件中增加:
management.metrics.web.server.auto-time-requests=false设置为false,默认为true -
b、重写
WebMvcTagsProvider,目的是去掉WebMvcTags.exception(exception)
package com.sinosoft.config;

import io.micrometer.core.instrument.Tag;
import io.micrometer.core.instrument.Tags;
import org.springframework.boot.actuate.metrics.web.servlet.WebMvcTags;
import org.springframework.boot.actuate.metrics.web.servlet.WebMvcTagsProvider;

import javax.servlet.http.HttpServletRequest;
import javax.servlet.http.HttpServletResponse;

/**
 * @ClassName: MyTagsProvider
 * @Description: TODO
 * @author: Created by xxx <a href="xxx@163.com">Contact author</a>
 * @date: 2019/2/27 13:49
 * @Version: V1.0
 */
public class MyTagsProvider implements WebMvcTagsProvider {

    /**
     * 去掉WebMvcTags.exception(exception)
     *
     * @param request   请求
     * @param response  响应
     * @param handler   处理
     * @param exception 异常
     * @return
     */
    @Override
    public Iterable<Tag> getTags(HttpServletRequest request, HttpServletResponse response, Object handler, Throwable exception) {
        return Tags.of(WebMvcTags.method(request), WebMvcTags.uri(request, response), WebMvcTags.status(response));
    }

    @Override
    public Iterable<Tag> getLongRequestTags(HttpServletRequest request, Object handler) {
        return Tags.of(WebMvcTags.method(request), WebMvcTags.uri(request, null));
    }
}
然后将重写后的MyTagsProvider进行Bean注入
package com.sinosoft.config;

import org.springframework.context.annotation.Bean;
import org.springframework.context.annotation.Configuration;

/**
 * @ClassName: TagsProvideBean
 * @Description: TODO
 * @author: Created by xxx <a href="xxx@163.com">Contact author</a>
 * @date: 2019/2/27 13:54
 * @Version: V1.0
 */
@Configuration
public class TagsProvideBean {

    /**
     * 将MyTagsProvider注入
     *
     * @return
     */
    @Bean
    public MyTagsProvider myTagsProvider() {
        return new MyTagsProvider();
    }

}
3. 启动zipkin-server服务
package com.sinosoft;

import org.springframework.boot.SpringApplication;
import org.springframework.boot.autoconfigure.SpringBootApplication;
import org.springframework.cloud.client.discovery.EnableDiscoveryClient;
import zipkin2.server.internal.EnableZipkinServer;

/**
 * @ClassName: ZipkinApplication
 * @Description: 调用链服务启动入口
 * @author: Created by xxx <a href="xxx@163.com">Contact author</a>
 * @date: 2019/2/27 11:43
 * @Version: V1.0
 */
@SpringBootApplication
@EnableDiscoveryClient
@EnableZipkinServer
public class ZipkinApplication {
    public static void main(String[] args) {
        SpringApplication.run(ZipkinApplication.class, args);
    }
}
Zipkin客户端构建
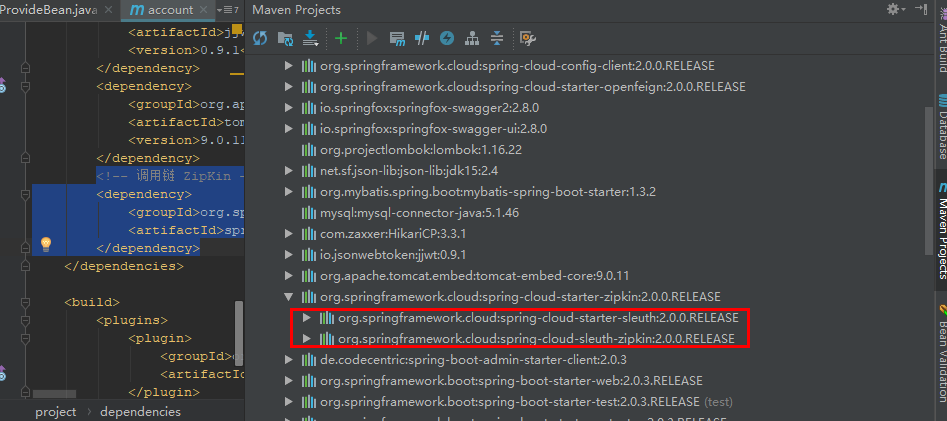
1. 引入依赖
<!-- 调用链 ZipKin -->
<dependency>
    <groupId>org.springframework.cloud</groupId>
    <artifactId>spring-cloud-starter-zipkin</artifactId>
</dependency>
注:spring-cloud-starter-zipkin 已经包含了 spring-cloud-starter-sleuth
2. 配置文件
---
# 调用链 Sleuth + ZipKin
spring:
  sleuth:
    web:
      client:
        enabled: true
    sampler:
      probability: 1.0 # 采用比例,默认 0.1 全部采样 1.0
  zipkin:
    base-url: http://localhost:9411/ # 指定了Zipkin服务器的地址
Zipkin效果展示
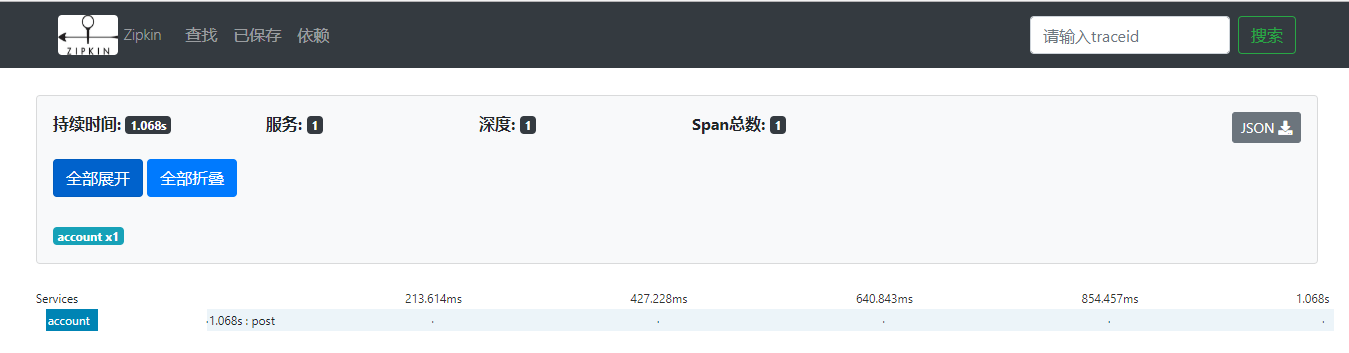
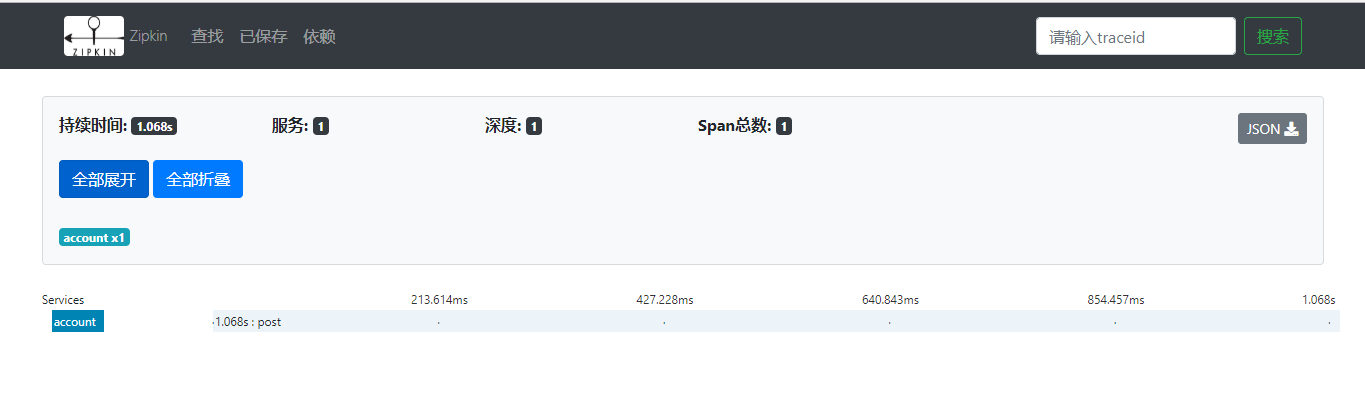
zipkin服务端及客户端启动之后,访问:http://localhost:9411/zipkin/
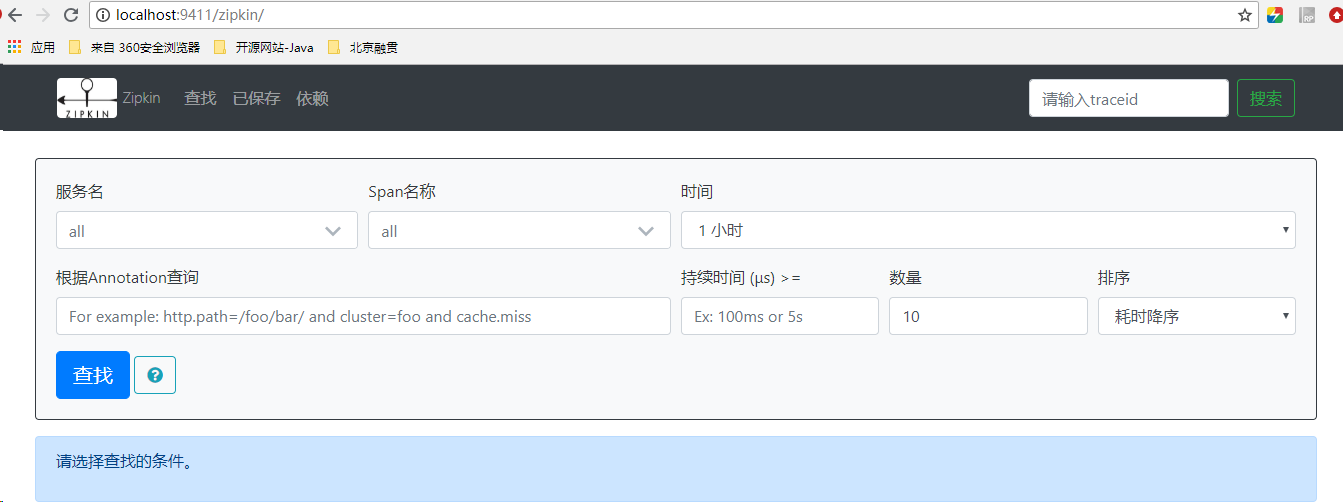
默认是查找所有的服务对应的链路,如果需要查询指定服务的链路跟踪情况,可以选择对应的服务名、Span名称等其他条件,点击查询即可显示本服务下的链路跟踪结果。
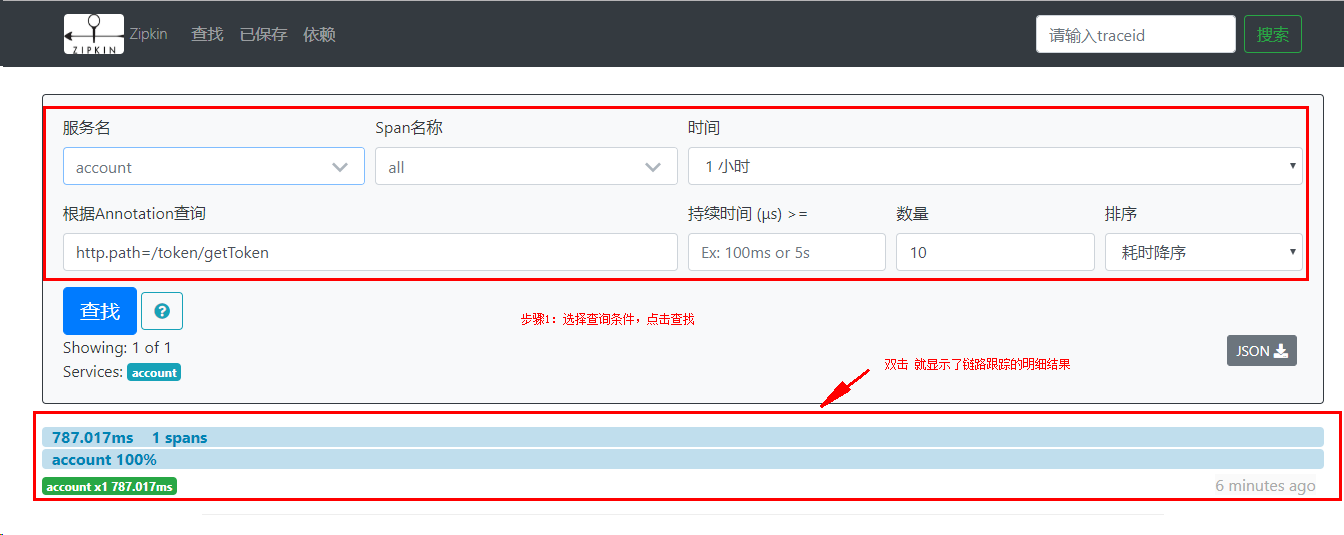
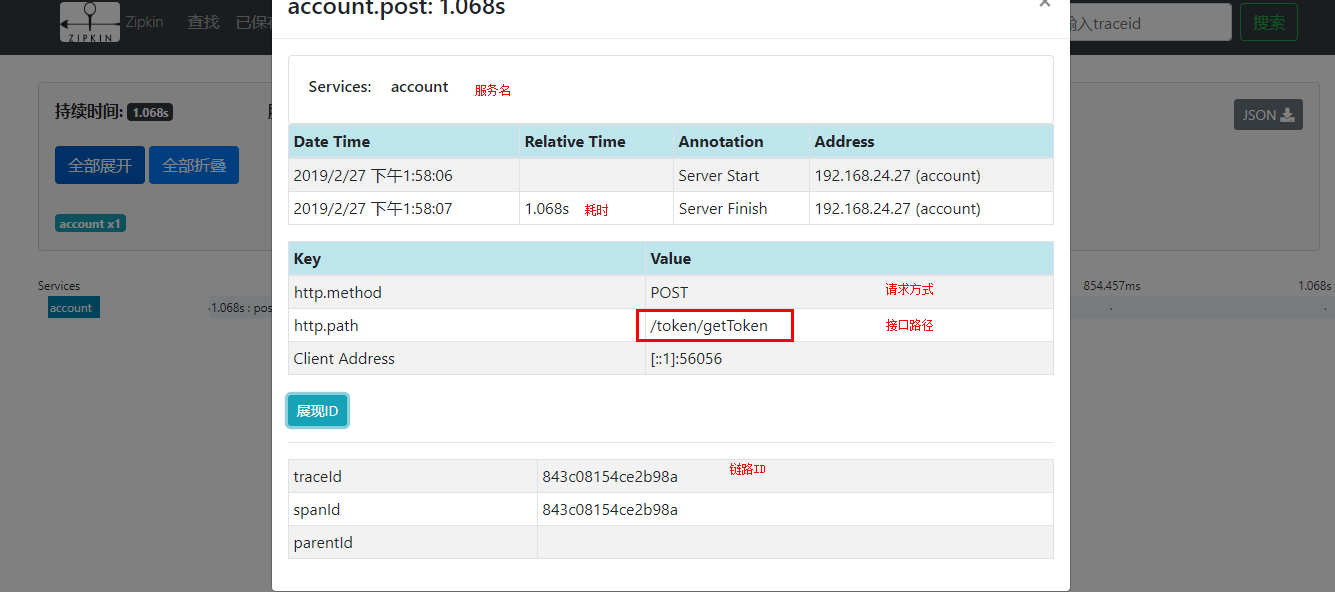
链路跟踪明细: